Two important images
As Arctic sea ice continues to decline, breaking one record after the other, one wonders what more can be said to capture the significance of what is happening. Two images spring to mind.
The image below, from The Cryosphere Today, shows that Arctic sea ice has shrunk in area by 11.41475 million square km from March 28, 2012, to September 6, 2012, a fall of about 83¼ percent in 162 days.
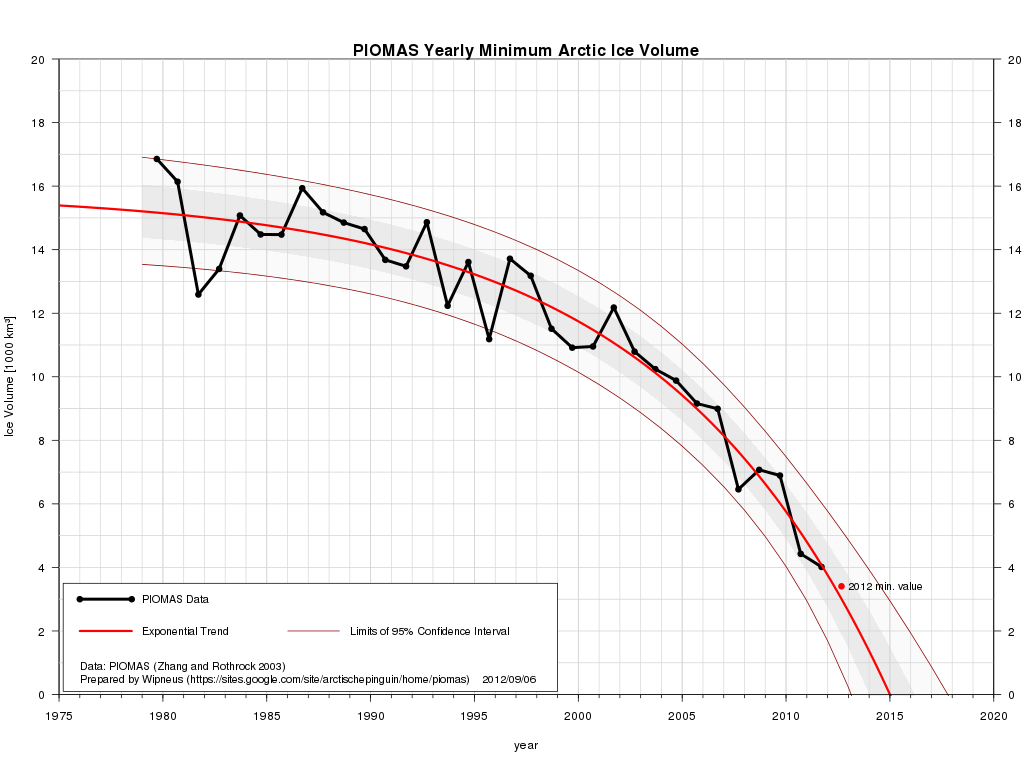
The image below illustrates the dramatic drop in sea ice volume over the years. The image is based on data calculated by the Pan-Arctic Ice Ocean Modeling and Assimilation System (PIOMAS) developed at the Applied Physics Laboratory/Polar Science Center at the University of Washington.
The PIOMAS data for the annual minimum values are the black dots. The trend (in red) is added by Wipneus and points at the start of the year 2015 as the moment when ice volume will first reach zero. The red point indicates the most recent value for 2012 volume, noting of course that this value may still come down further as the year progresses.


