Record Methane in Arctic early March 2013
The image below, produced by Dr. Leonid Yurganov, shows methane levels for the first ten days of March 2013.
Methane levels for this period are at record highs in the Barents and Norwegian Seas, i.e. the highest levels ever recorded by IASI, which is is short for Infrared Atmospheric Sounding Interferometer, a Fourier transform spectrometer on board the European EUMETSAT Metop satellite that has supplied data since 2007.
The record levels are indicated on the image below at the top right, while the geographical location of the four domains distinguished in the image are illustrated on the image further below.
The image at the top of this post displays average methane levels for the period March 1 to 10, 2013, at 600 mb. On individual days and on specific locations, methane levels could be much higher, as illustrated by the NOAA image below showing methane levels reaching a high of 2237 ppb on March 6, 2013, at 742 mb. The empty image further below is added to help distinguish land contours.
The earlier post Dramatic increase in methane in the Arctic in January 2013 showed that high methane levels lined up closely with the contours of land and sea ice. The same is the case for the record levels of methane in early March, as illustrated by the animation below.
Finally, two maps showing temperature anomalies. The NOAA image below shows Sea Surface Temperature anomalies of over 8 degrees Celsius on March 8, 2013.
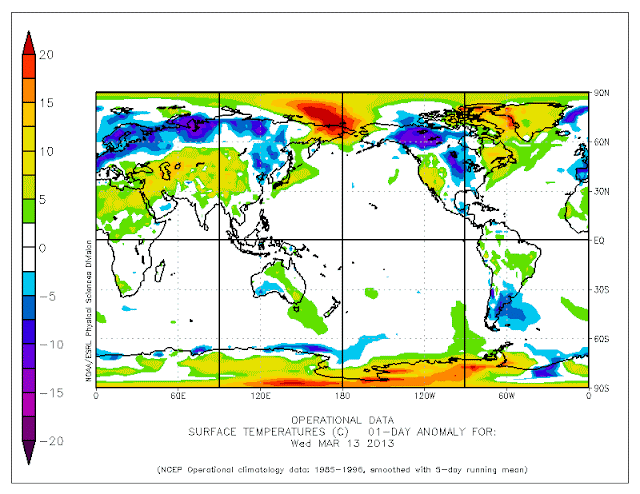
Air temperatures are more volatile than sea temperatures, as the wind can quickly change the situation. The image below shows how, as the jet stream weakens in speed and becomes more wavier, large patches with over 20 degrees Celsius surface temperature anomalies can extend into the Arctic.
BTW, the above image also shows large temperature anomalies in Antarctica, which has also shown high levels of methane recently. This will be discussed in more detail in a post elsewhere soon.
Methane levels for this period are at record highs in the Barents and Norwegian Seas, i.e. the highest levels ever recorded by IASI, which is is short for Infrared Atmospheric Sounding Interferometer, a Fourier transform spectrometer on board the European EUMETSAT Metop satellite that has supplied data since 2007.
The record levels are indicated on the image below at the top right, while the geographical location of the four domains distinguished in the image are illustrated on the image further below.
The image at the top of this post displays average methane levels for the period March 1 to 10, 2013, at 600 mb. On individual days and on specific locations, methane levels could be much higher, as illustrated by the NOAA image below showing methane levels reaching a high of 2237 ppb on March 6, 2013, at 742 mb. The empty image further below is added to help distinguish land contours.
The earlier post Dramatic increase in methane in the Arctic in January 2013 showed that high methane levels lined up closely with the contours of land and sea ice. The same is the case for the record levels of methane in early March, as illustrated by the animation below.
 |
| IASI methane levels March 1-10, 2013 against NSIDC sea ice concentration map March 12, 2013. Note: this is a 3.09 file that may take some time to fully load. |
Air temperatures are more volatile than sea temperatures, as the wind can quickly change the situation. The image below shows how, as the jet stream weakens in speed and becomes more wavier, large patches with over 20 degrees Celsius surface temperature anomalies can extend into the Arctic.
BTW, the above image also shows large temperature anomalies in Antarctica, which has also shown high levels of methane recently. This will be discussed in more detail in a post elsewhere soon.


